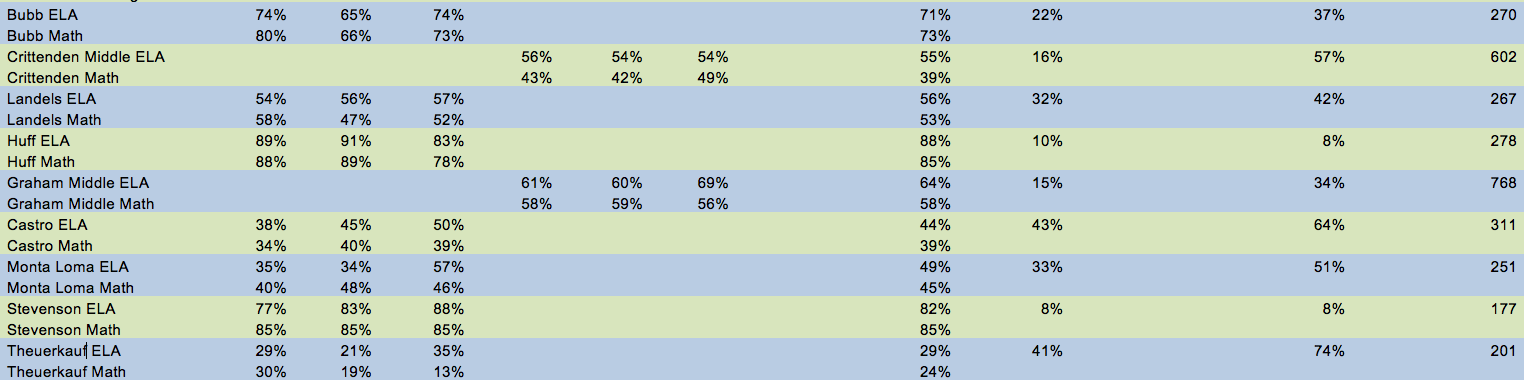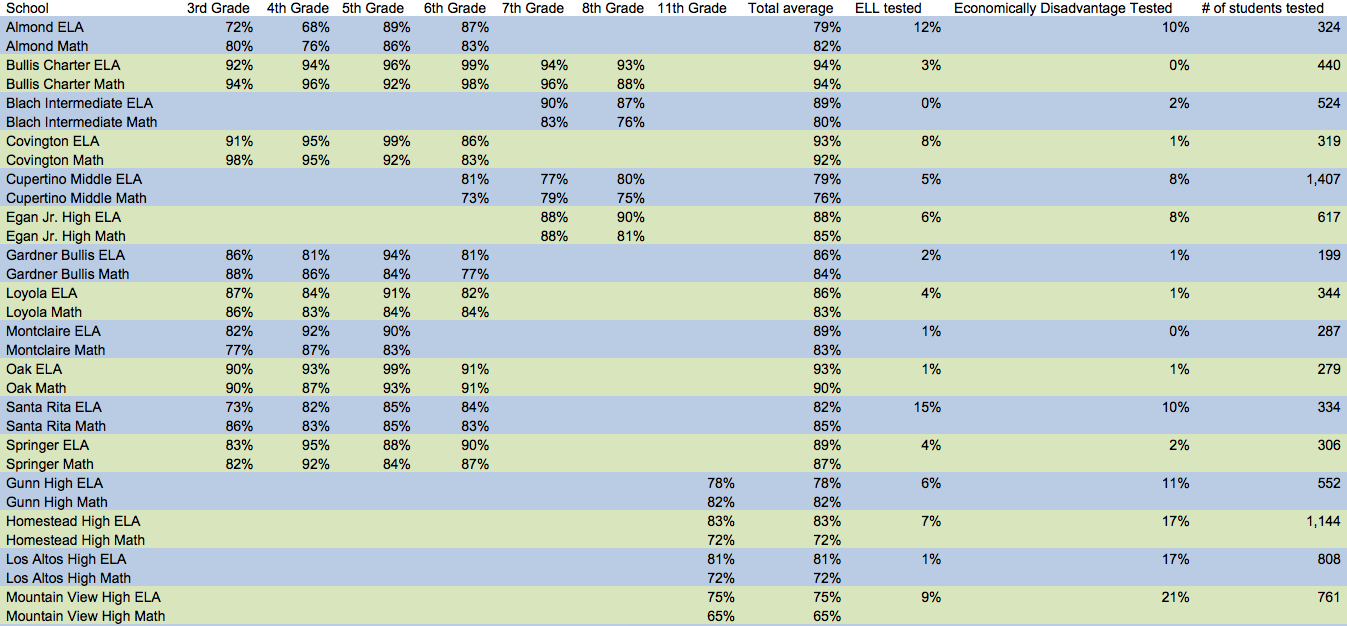
The California Department of Education released the California Assessment of Student Performance and Progress today. The Town Crier has compiled a graph of all local public schools showing the percentages for each grade and school of students scoring Standard Met and Standard Exceeded in the English Language Arts (ELA) and Mathematics tests. The graph also shows how many students at each school were tested and the percentages of English Language Learners (ELL) and Economically Disadvantaged students.
These new online assessments were administered to local students last spring to gauge their progress in learning new, more rigorous academic Common Core standards designed to prepare them for college and careers in the 21st century.
Because 2015 is the first year of the new tests and because they are substantially different from their predecessors and serve as a baseline from which to measure future progress, state officials said they should not be compared to results from the state’s previous assessments, the Standardized Testing and Reporting (STAR) program.
To enlarge and read the full graph, please click on the image. For Mountain View Whisman School District results, click forward to the second image.
For the full listing of state data, visit caaspp.cde.ca.gov.